
 MoneyStatsReport Editors
In this article
The number at the top of the latest Fidelity release was $155,800. That is the average 401(k) balance across the workplace plans Fidelity runs, measured on June 30, 2026, and it is the highest average the company has ever reported.
A few headlines since then have said Americans reached that number “in 2026.” Small correction. The figure is one snapshot, taken at the end of the second quarter, of 25.8 million people with a 401(k) at work through Fidelity.
It does not describe the average American, and it does not describe the typical saver. Both details change what the number means for your own statement.
What Fidelity Actually Reported
View this post on Instagram
The Fidelity Q2 2026 retirement analysis covers 27,300 corporate plans and 25.8 million participants as of June 30, 2026. The average IRA balance there reached $144,523 and the average 403(b) reached $145,000, so the 401(k) was not alone.
Savers also kept their total savings rate at a record 14.4% of pay for a second straight quarter, made up of 9.6% from employees and 4.8% from employers.
According to the company announcement on the Q2 results, the average 401(k) rose 10.5% in a single quarter. Fidelity has not reported a bigger quarterly gain since the fourth quarter of 2020, when balances rose 10.8%. Against the $137,800 average a year earlier, shown in the table below, the twelve-month gain works out to 13.1%.
A number is easier to trust when it sits in a row with its neighbors, so here are the last five quarters. The figures come from trade coverage of the reports for the second and third quarter of 2025, the Fidelity year-end 2025 analysis, and the first first quarter of 2026.
| Quarter ending | Average Fidelity 401(k) balance | Change from prior quarter |
| June 30, 2025 | $137,800 | Up 8% from $127,100 |
| September 30, 2025 | $144,400 | Up 5% |
| December 31, 2025 | $146,400 | Up 1% |
| March 31, 2026 | $141,000 | Down about $5,400 |
| June 30, 2026 | $155,800 | Up 10.5%, a record balance |
Look at March. Balances slipped about $5,400 in the first quarter, then made it back and then some by June. If you opened your statement in April and closed it again fast, the June statement was the better read.
Where the Extra $14,800 Came From
Mortgage underwriters ask borrowers to explain every large deposit. A sudden $9,000 jump in a checking account needs a letter saying where it came from.
Retirement numbers deserve the same treatment.
The average balance rose $14,800 between March and June. A 401(k) grows from two sources, new contributions and market returns, and in a single strong quarter the market usually does most of the work. Kiplinger reported that the S&P 500 posted a total return of 15.2% in the second quarter, its best quarter in six years.
The S&P 500 just had the best Q2 returns ever in a midterm year.
It was the 5th best Q2 overall ever. https://t.co/8qDvtF2wyk
— Ryan Detrick, CMT (@RyanDetrick) July 1, 2026
Here is a rough illustration with numbers we chose, not numbers from Fidelity. A worker earning $60,000 who saves the average 14.4% puts in about $2,160 per quarter, counting the employer share. On a $141,000 balance, that adds about 1.5%. Most of the remaining nine points of the 10.5% gain came from the market.
One more detail most coverage skips. An average is not the same group of people every quarter. New hires join with tiny balances, and retirees roll large balances out of the plan. The headline average moves with markets and contributions, and also with who happens to be in the pool on June 30.
The Average Is Not the Typical Saver
Take two hypothetical savers, one with a 401(k) near $900,000 and another with about $3,100. Their average is roughly $451,500, a number that describes neither of them. Retirement statistics have the same problem, only on a much larger scale.
Fidelity’s latest figures show how much the highest balances influence the average:
- 769,000 401(k) millionaire accounts at the end of June 2026, up 19% from the previous quarter, according to Bloomberg.
- 595,000 millionaire accounts a year earlier, according to PLANSPONSOR, representing roughly 29% annual growth.
- About 3% of accounts held at least 19% of total balances, based on my estimate using Fidelity’s $155,800 average and 25.8 million participants.
That last figure is our calculation, not a Fidelity number. It assumes every millionaire account holds exactly $1 million, so their actual share could be higher.
The median tells a different story. Fidelity does not include one in these quarterly figures, but Vanguard’s 2026 report provides a useful comparison:
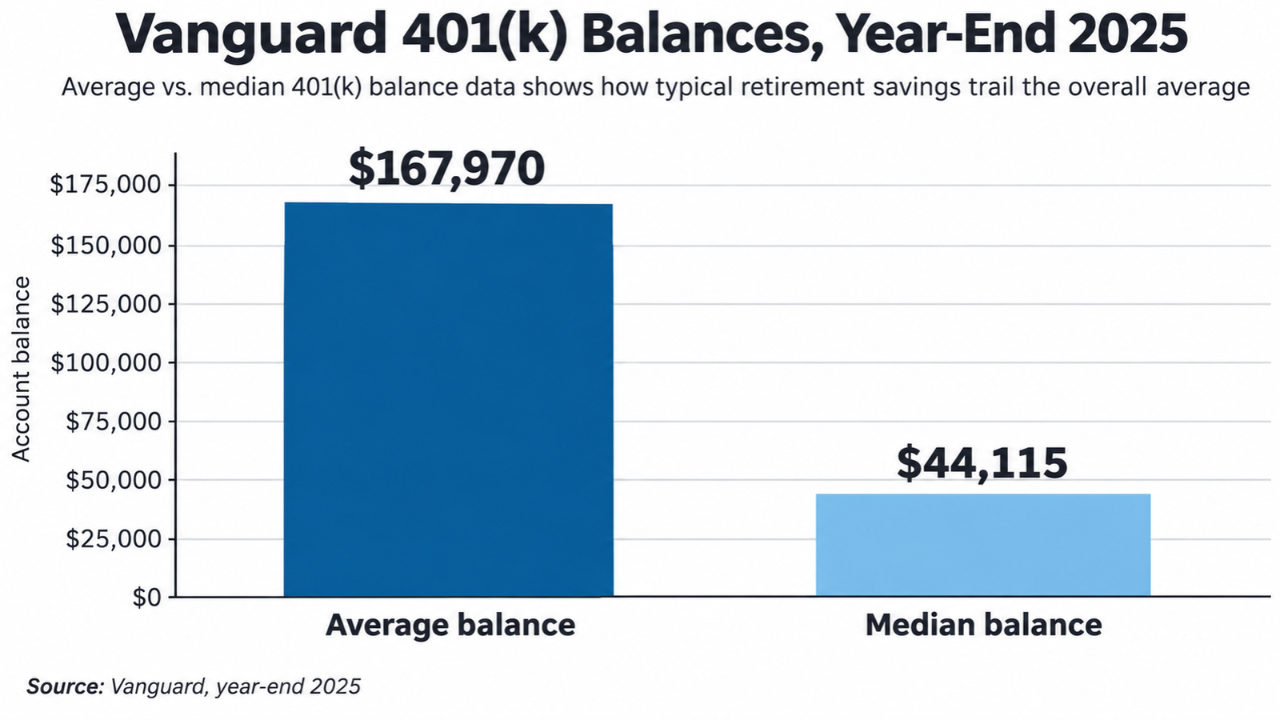
The typical Vanguard participant had about a quarter of the average balance. If your retirement savings are closer to $44,000 than $155,800, you have plenty of company.
Average 401(k) Balances by Age and Generation
The age breakdown matters more than the headline. Kiplinger published the Fidelity Q2 2026 averages by decade alongside the Fidelity savings guidelines, which measure progress as a multiple of salary.
Age
Fidelity savings guideline
Average 401(k), Q2 2026
Average 401(k), Q1 2026
20s
No set multiple
$22,800
$20,600
30s
1x salary by 30
$75,200
$66,900
40s
3x salary by 40
$156,800
$140,500
50s
6x salary by 50
$263,500
$237,800
60s
8x by 60, 10x by 67
$281,200
$257,900
70s
No set multiple
$286,900
$264,500
Born in 1972, I sit in the 50s row and in Gen X. My balance will not appear here. It lives in a spreadsheet I named “Later,” and it stays there.
The salary multiple is the line I watch, because it scales to my pay. A $263,500 average means little to someone earning $48,000 and something quite different to someone earning $140,000.
By generation, the averages and the share of savers carrying a 401(k) loan look like this.
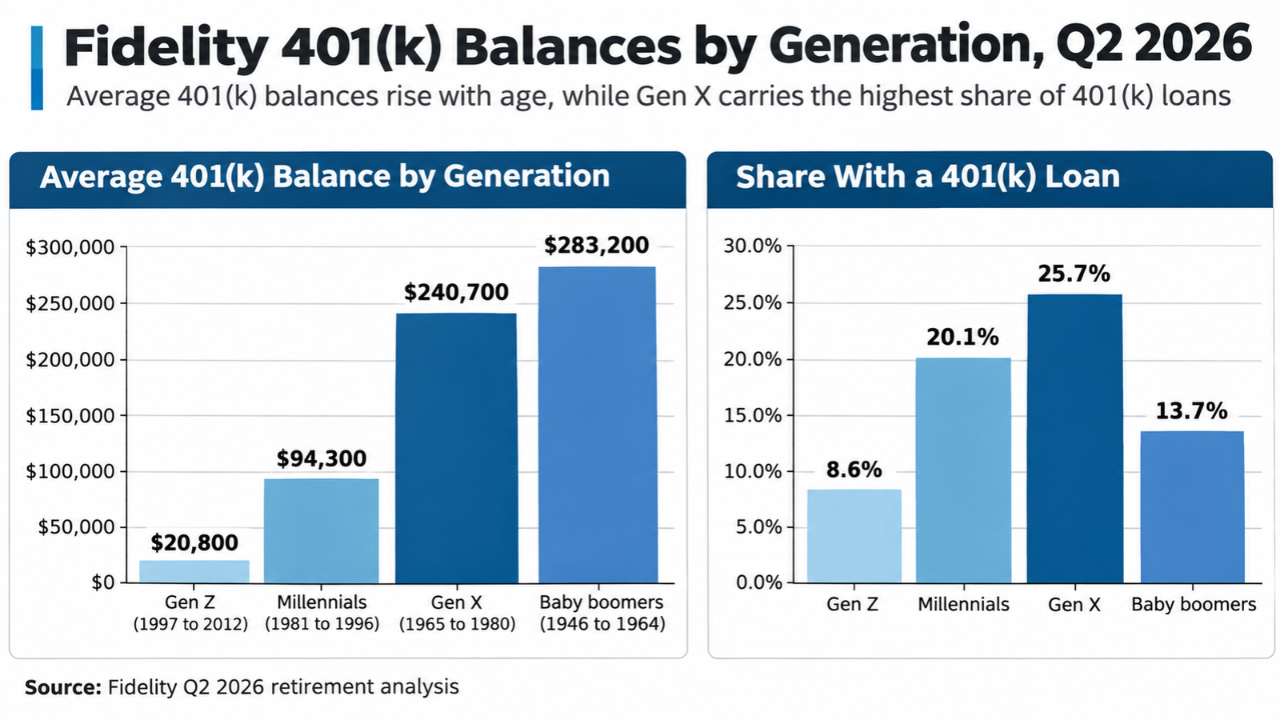
Millennials had the best year. Their average rose 14.2% in the quarter and 26.1% over twelve months, according to Fidelity. My generation had the most loans. One in four Gen X savers owed money to their own retirement account.
The Part of the Report I Did Not Like
Record 401(k) balances came with a troubling trend. According to TheStreet’s coverage of Fidelity:
- 19.5% of workers had an outstanding 401(k) loan.
- 2.8% took a new loan in the second quarter.
- 3% took a hardship withdrawal, up from 2.6% a year earlier.
The figures are confirmed, but Fidelity does not explain why people needed the money.
The temptation is easy to understand. Picture a worker with a five-figure credit card balance and a healthy 401(k). A loan from the plan could wipe out the cards immediately. The trade-off is less visible. The borrowed money misses any market gains while it is out of the account, and repayment becomes tied to the job.
That employment risk matters. Under IRS rules, most 401(k) loans must be repaid within five years. Defaulting can trigger income taxes and an additional tax for early distributions. Leaving your job may also accelerate repayment, depending on the plan.
A 401(k) loan is not always a bad choice, especially against credit card interest rates reaching 21.19%. But the real cost includes potential investment gains you miss while the money is out of your account.
What I Would Do With This Number
A familiar pattern shows up in workplace enrollment. Some people contribute 2% when the employer match pays up to 3%, and others never finish enrolling at all.
Fidelity says 81.2% of its savers get the full match, which means almost one in five do not. I wrote about the same gap in why only 52% of private-sector workers participate, and the reasons are usually paperwork and silence, not laziness.
Workers with student loans may have another option, since some employers now match student debt payments with 401(k) contributions even if employees contribute nothing themselves.
- Find your match formula and meet it. Kiplinger notes that the most common Fidelity formula matches 100% of the first 3% you save and 50% of the next 2%. On a $55,000 salary, saving 5% means $2,750 from you and $2,200 from your employer. No other line on your pay stub returns 80 cents per dollar on day one.
- Compare yourself to your row, not the headline. Use the age table above and the salary multiple for your decade. A 32-year-old with 1.2x salary saved is ahead of the 1x-by-30 guideline, even with a balance far below $155,800.
- Use the 2026 limits if you are catching up. The IRS 2026 contribution limits let you defer up to $24,500, plus $8,000 if you are 50 or older. Savers aged 60 to 63 can add $11,250 instead of $8,000.
- Leave the loan for real emergencies. If you already have one, keep it current and know what happens to it if you change jobs.
A quick reality check on what $155,800 buys. Under the common 4% withdrawal guideline, it supports about $6,232 a year, or roughly $519 a month, before taxes. That is a useful supplement to Social Security, but it does not offer the lifetime guarantee of a monthly pension.
When the Next Number Arrives

Fidelity has not announced a release date for the third-quarter 2026 report. Last year, the Q3 2025 analysis came out on November 20, so a similar late-November release would fit the pattern. That is an expectation, not a confirmed date.
We also will not guess whether the average sets another record. Markets have moved since June 30, and forecasting them is not what this article is for.
One thing is worth doing this week. Pull up your 401(k) statement dated June 30, 2026, and write three numbers on a sticky note. Your balance, your total contribution rate including the match, and your salary multiple from the table above.
When Fidelity publishes the next quarter, we will add a row to the first table. Add a row to your sticky note, and you will know whether you moved, which matters more than where the average went.
This article is general information, not personal financial advice.